ELLIOT WAVE THEORY
Elliot theory says,
A retracement of more than 76% is highly suspicious, although it doesn’t break any rules yet.
NIFTY 76% from previous trend is 4468. Play carefully above 4468 till 4650.
HOURLY CHART

SHORT TERM CHART

using FIBONACCI SERIES (also by 3 days consistent up trend) using 38.2%, 50% & 61.8% ( 23.6% need to be considered sometime as elliot wave theory)
SUPPORT
Elliot wave theory support by 23.6% @ 4395
4337 -- 4282 -- 4243.7
RESISTANCE
4575.8 -- 4615 -- 4653
-----------------------------------------------------------------------------------
using TREND LINES in the chart
TODAY breaks 4422 will take to 4384---4370-- 4322
major support 4384-4370 (channel break)
If breaks 4322 then?? (major channel break)
TODAY IF CROSSES 4509 will take to 4575.8 -- 4615
If crosses 4615 -- 4653 then???
-----------------------------------------------------------------------------------
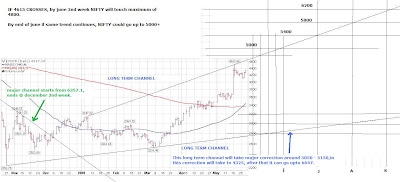
MEDIUM & LONG TERM CHANNEL


